
Industrial UAV buyers and OEM engineering leads hear the same claims every quarter: “over 120 minutes,” “industry-claimed efficiency,” “long-endurance benchmark.” Marketing materials compress multirotor aerodynamics, electrochemistry, and thermal behavior into a single headline number.
If a team accepts that number without the underlying configuration and test boundary, the selected powertrain often underperforms on the real maximum takeoff weight (MTOW), mission payload, battery platform, or wind profile. This guide defines the Endurance Evidence Ladder (L1–L6) and the minimum disclosure set OEMs should require before treating any flight-time claim as procurement-grade engineering evidence.
- Isolated minutes are marketing: Endurance is an aircraft-level result—only minutes + full hardware configuration + measured environment is auditable evidence.
- L1–L2 are not PO-grade: Shortlist entry requires L4 configuration disclosure; production freeze should require L5 telemetry and preferably L6 A/B flights.
- Use rated system points: IPET I7 (KV80 + 14S FOC 50A + I30) is published at 12.8 g/W at 2.6 kg/rotor (peak 13.23 g/W at 2.5 kg)—not a light-load catalog peak.
- Worked audit model: A 24 kg hex energy model with explicit assumptions yields a reverse-solve filter that rejects physically unreachable claims in minutes.
Why Endurance Numbers Without Test Conditions Mislead
Endurance is not an independent property of a motor, ESC, or battery. It is an aircraft-level outcome driven by tightly coupled variables:
- MTOW and mission payload mass
- Cell chemistry, nominal energy, usable depth of discharge (DoD), and cutoff voltage
- Propeller diameter, geometry, and rated RPM
- Per-rotor hover and cruise thrust demand
- Atmosphere (altitude, temperature, humidity, turbulence)
- Airframe drag area and flight-control throttle strategy
A supplier can truthfully log a long hover on a stripped prototype. That does not mean the same powertrain will support a fully loaded inspection platform. Without the test boundary the number is not transferable.
Treat every endurance claim as a single data point bound to a complete configuration package. Isolated minutes are marketing; minutes plus hardware plus measured environment are procurement evidence.
The Endurance Evidence Ladder (L1–L6)
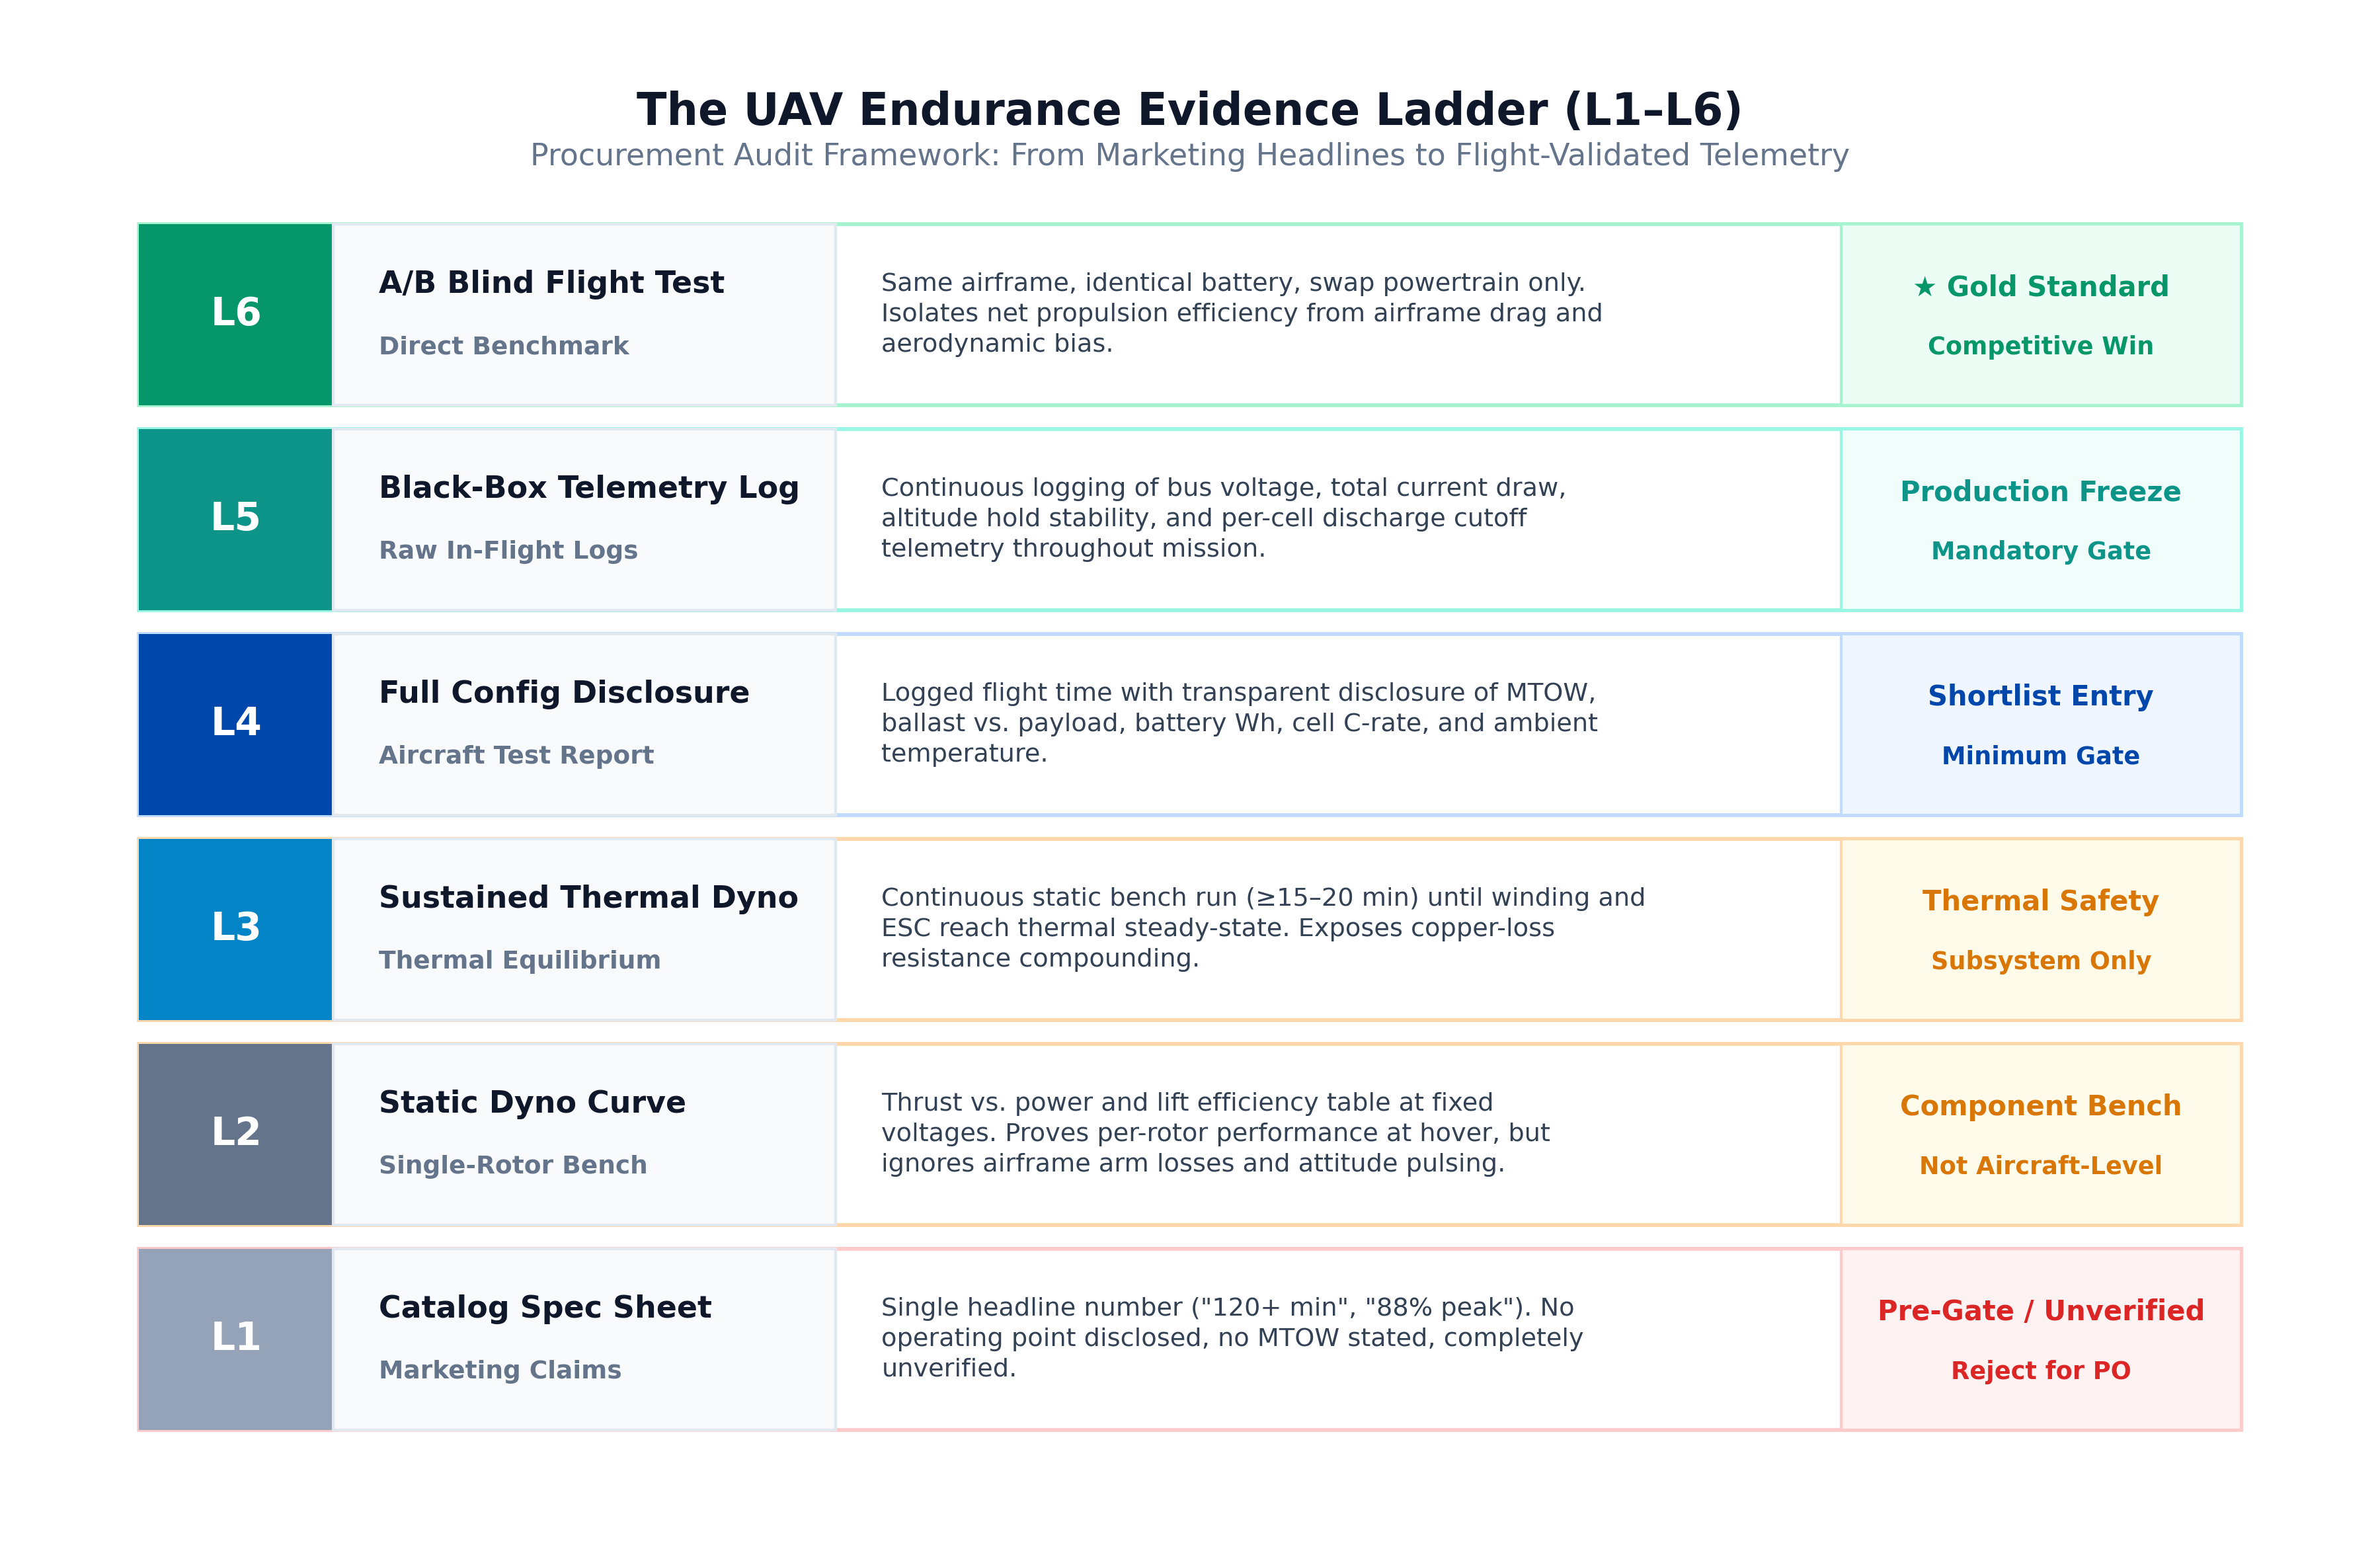
| Level | Evidence form | What it proves | What it cannot prove |
|---|---|---|---|
| L1 Claim | Catalog figure | Design intent | Performance on your airframe |
| L2 Dyno curve | Static thrust–efficiency table | Per-rotor efficiency at stated voltage, thrust, prop | Installed flight time and thermal behavior |
| L3 Sustained thermal | Continuous-load thermal balance | Winding/magnet risk under steady load | Mission productivity and pack dynamics |
| L4 Config disclosure | Flight report with MTOW and battery | That sample achieved that duration | Repeatability on your aero shell and climate |
| L5 Black-box log | Raw current/voltage/altitude/temperature | Discharge consistency and power profile | Long-term durability in salt fog or extreme gusts |
| L6 A/B blind test | Same-airframe comparative flights | Net powertrain benefit after airframe bias | Generalization beyond that airframe |
L2 Example: I7 Dyno Points (Bench, Not Flight)
The table below is from IPET’s I7 (KV80) + 14S FOC 50A + I30 (30″) bench sweeps. It shows why efficiency must be read at your hover thrust, not at the lightest point on the curve:
| Bus | Throttle | Thrust | Current | Electrical power | Overall efficiency (g/W) |
|---|---|---|---|---|---|
| ≈60 V | 40% | 2,638 gf | 3.49 A | 209 W | 12.61 |
| ≈60 V | 45% | 3,292 gf | 4.74 A | 284 W | 11.59 |
| ≈60 V | 50% | 3,988 gf | 6.28 A | 376 W | 10.62 |
| ≈54 V | 45% | 2,684 gf | 3.89 A | 209 W | 12.82 |
| ≈54 V | 50% | 3,256 gf | 5.12 A | 276 W | 11.81 |
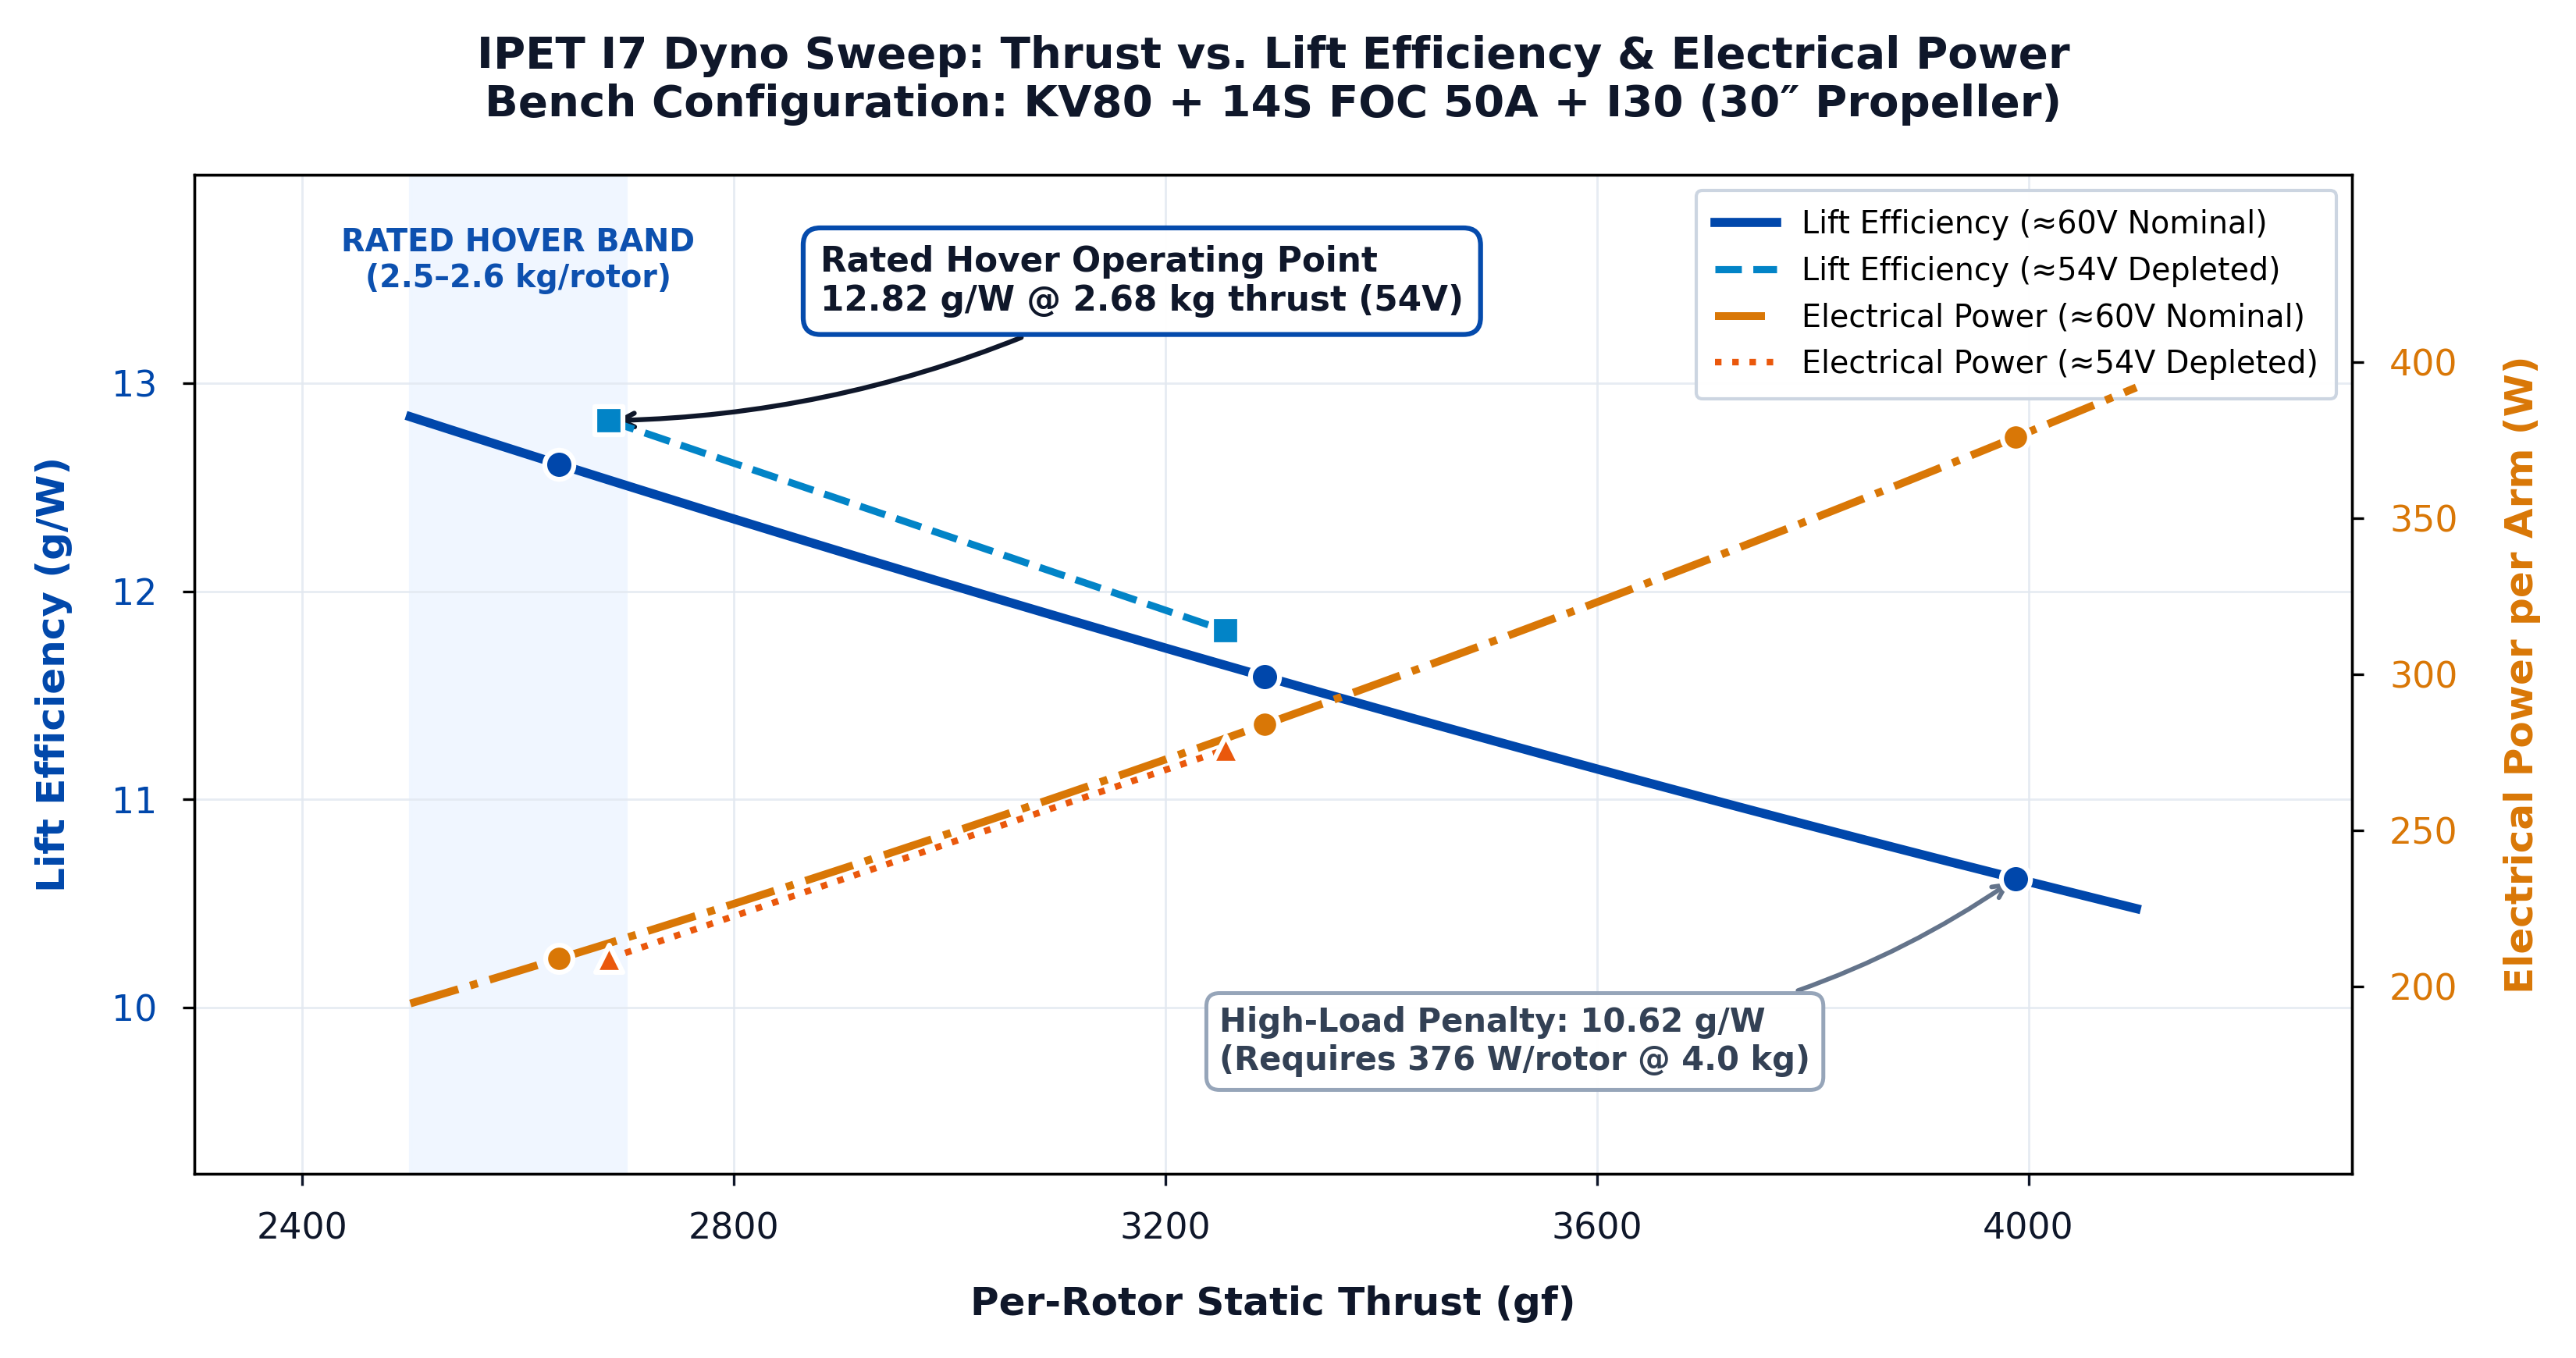
As thrust rises from about 2.6 kg toward 4.0 kg on this stack, overall efficiency falls from roughly 12.6–12.8 g/W toward about 10.6 g/W. Published rated figures for this configuration include 13 g/W at 2.5 kg (spec sheet) and 12.8 g/W at 2.6 kg (rated hover point). Source workbooks: I7 dyno and specification sheets in IPET engineering release.
L4 Example: Verified Aircraft Configuration
Endurance numbers must be tied to a verified aircraft package. The published IPET hover benchmark uses a 1000 mm industrial quadcopter at 10.25 kg MTOW with a 12S 36 Ah high-density semi-solid battery pack (~6.25 kg pack mass, ~255 Wh/kg cell specific energy, 95% usable DoD down to 3.0V/cell cutoff). At a design hover thrust of 2,562 g/rotor (10,250 g ÷ 4), the I7 + I30 powertrain draws ~200 W per arm (~800 W total propulsion power). Logged continuous flight duration reached 120+ minutes in calm air. Always require the full configuration block—including battery mass fraction (~61% here) and cell discharge cutoff—not merely the headline minute count.
Eight Mandatory Disclosures
| Field | Requirement |
|---|---|
| 1. Test MTOW | Measured takeoff mass including battery, airframe, avionics, payload. |
| 2. Payload mass & type | Real payload, ballast, or empty—state which. |
| 3. Pack engineering specs | Cell model, series/parallel, nominal mAh/Wh, pack mass. |
| 4. Discharge cutoff | Per-cell landing voltage or consumed capacity/DoD. |
| 5. Motor + ESC identity | Stator/KV, ESC model, and commutation firmware. See our analysis on why standalone component peaks fail as an integrated system. |
| 6. Propeller identity | Diameter, pitch, blade count, material/lot. |
| 7. Environment log | Altitude, temperature, humidity, average wind. |
| 8. Mission profile | Indoor ground-effect, outdoor hover, or mapped route. |
Auditable Energy Model (Calculation Template)
- P_hover (W) = MTOW (g) ÷ system lift efficiency η_sys (g/W)
- T_hover (h) = [ pack energy (Wh) × DoD × factor ] ÷ total power
Worked Calculation Example
The figures below are an illustrative template with assumed inputs, not a certified flight report. Replace every value with measured or factory-rated data:
| Parameter | Worked Example (24 kg Industrial Hexacopter) |
|---|---|
| Airframe / MTOW | 24.0 kg hexacopter (6 rotors); 14S LiPo/Semi-solid platform (51.8V nominal) |
| Usable pack energy | 14S 30 Ah (1,554 Wh nominal) × 80% usable DoD = 1,243.2 Wh usable |
| Per-rotor hover point | 24,000 g ÷ 6 = 4,000 g/rotor. Dyno efficiency at 4.0 kg thrust (I7-class): 10.62 g/W |
| Propulsion + avionics power | P_prop = 24,000 ÷ 10.62 = 2,260 W + avionics/payload (85 W) = 2,345 W total |
| Modeled hover time | T = 1,243.2 Wh ÷ 2,345 W = 0.530 hours = 31.8 minutes (1,908 seconds) |
If a supplier’s claim reverse-solves to an efficiency outside commercial physics at your thrust class, reject it before tooling.
Supplier Scorecard
| Dimension | Weight | 5 — Accept | 3 — Conditional | 1 — Red flag |
|---|---|---|---|---|
| Data transparency | 30% | 8 fields + raw logs | Core fields; cutoff incomplete | Marketing numbers only |
| Thermal stability | 25% | Sustained curves; decay stated | Short hold; decay unclear | Transient steps only |
| System delivery | 20% | Matched motor+ESC+prop test | Partial match; third-party prop | Motor only |
| Condition traceability | 15% | Env logged; reproducible | Standard sea-level only | “Ideal conditions” |
| Dynamic margin | 10% | Hover on efficiency plateau | Near high throttle | Very high hover throttle |
OEM Pre-Freeze Checklist
- MTOW converted to per-rotor design hover thrust
- Hover point on the high-efficiency band of the motor–prop map
- TWR band set for gust authority (commonly near 1.8:1–2.2:1 for industrial duty)
- Test temperature covers hottest field condition
- Continuous-load thermal decay curves obtained
- Battery cutoff matches field SOP
- ESC commutation and FC rates closed-loop tuned (DroneCAN / PWM on I-Series; no built-in BEC—power the FC separately)
How IPET Delivers Auditable Packs
IPET I7 and the wider I-Series ship as factory-matched motor + FOC ESC + propeller stacks under our integrated propulsion co-design architecture (for example I7 KV80 + 14S FOC 50A + I30 30″). N-Series covers harsh-environment sealing. Related reading: battery sizing study on a 1000 mm platform.
Conclusion: Buy Evidence, Not Minutes
- Require L4+ before shortlisting; L5/L6 before production freeze.
- Score transparency, thermal data, system matching, and condition traceability.
- Run the energy model; if the reverse-solved efficiency is unreachable at your thrust class, the claim is not evidence.
Contact IPET SYSTEM Engineering for raw test datasets, 3D integration models, and thrust-sizing worksheets.
Engineering FAQ
Bench tests run in open airflow with no arm interference or airframe downwash. Installed flight adds arm losses, throttle pulsing for attitude control, and avionics draw. Apply an airframe correction factor and validate on your platform.
Do not freeze on catalog claims or static dyno alone. Shortlist on L4 full configuration disclosure; production release should require L5 telemetry and preferably L6 same-airframe A/B flights.
Use the energy model: P_hover = MTOW / system g/W, then T = usable Wh ÷ total power. If the reverse-solved efficiency is physically unreachable at your thrust class, the claim is not engineering evidence.